.jpg)
Project information
- Category: Pollution Data Visualization
- Purpose: Uni Project
- Project date: March 2023
Background information
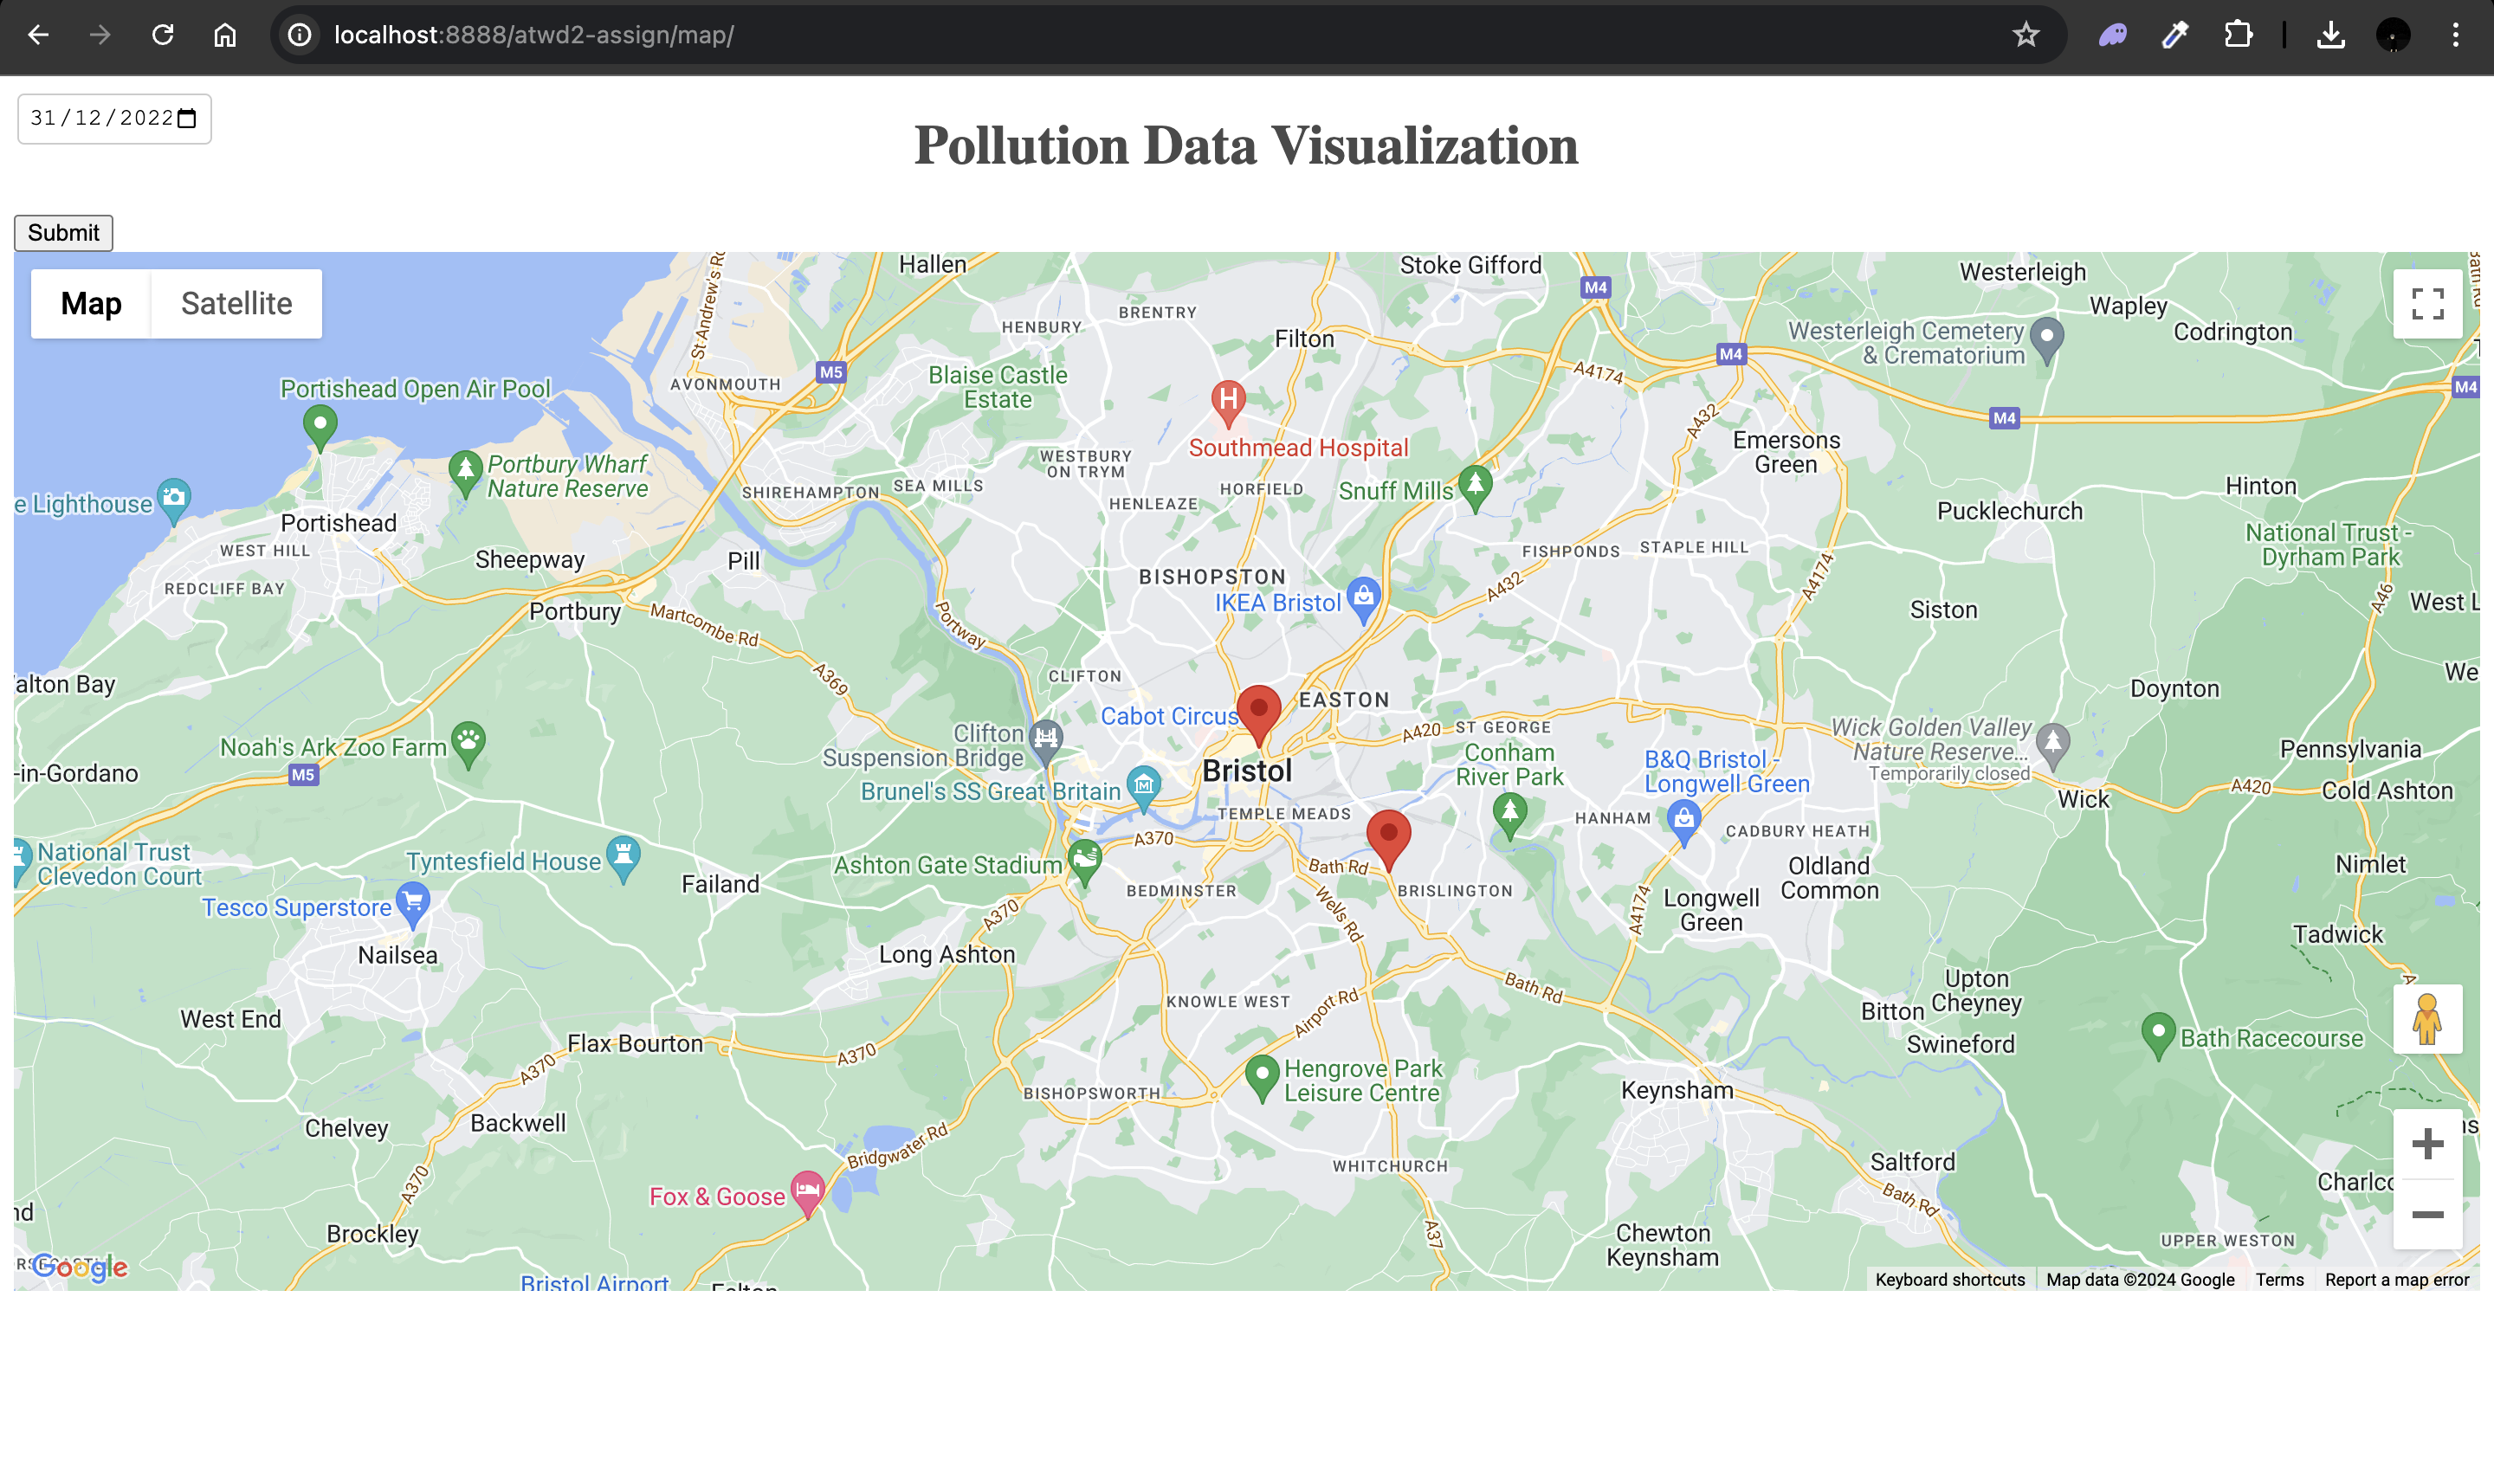
For my university project in Advanced Topics in Web Development, I developed a web-based application to measure, map, and process pollution data. As a backend developer, I used PHP to cleanse and normalize substantial real-world data and XML for data transformation and validation.
I implemented a PHP script to process raw pollution data from CSV files, generating cleansed CSV and normalized XML files. I designed an XML Schema (XSD) to validate the XML data, ensuring accuracy and consistency.
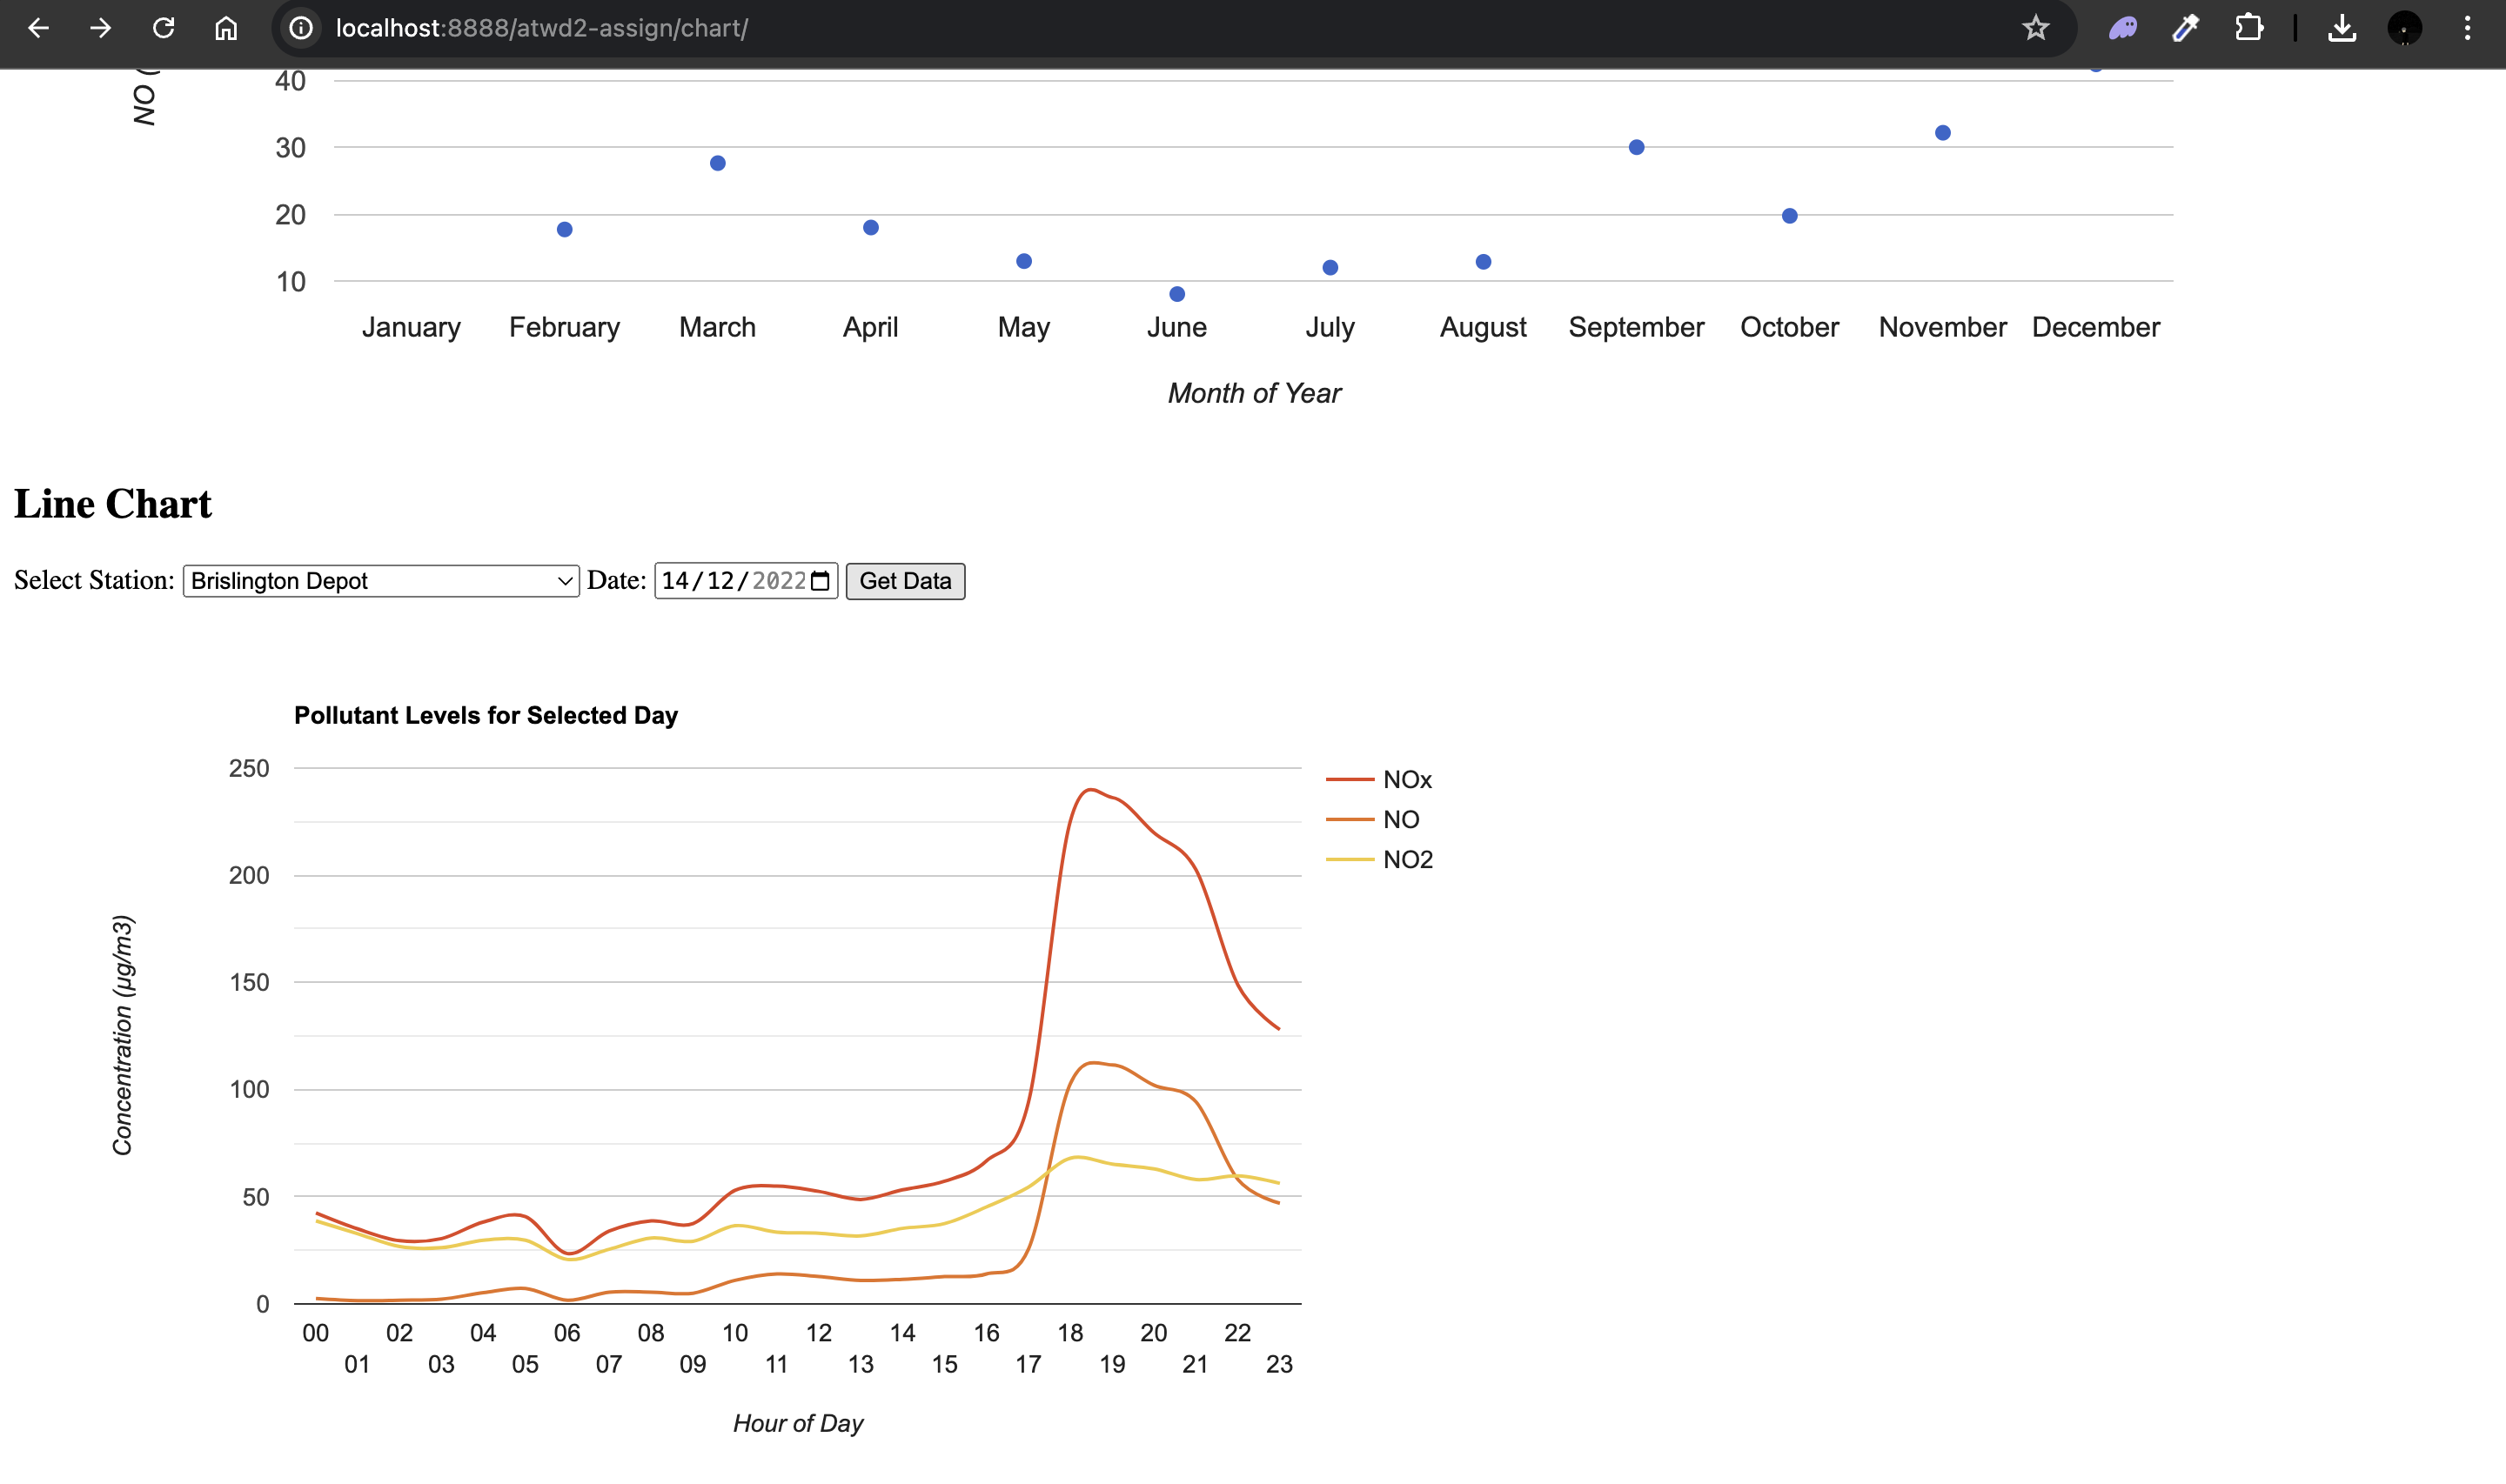
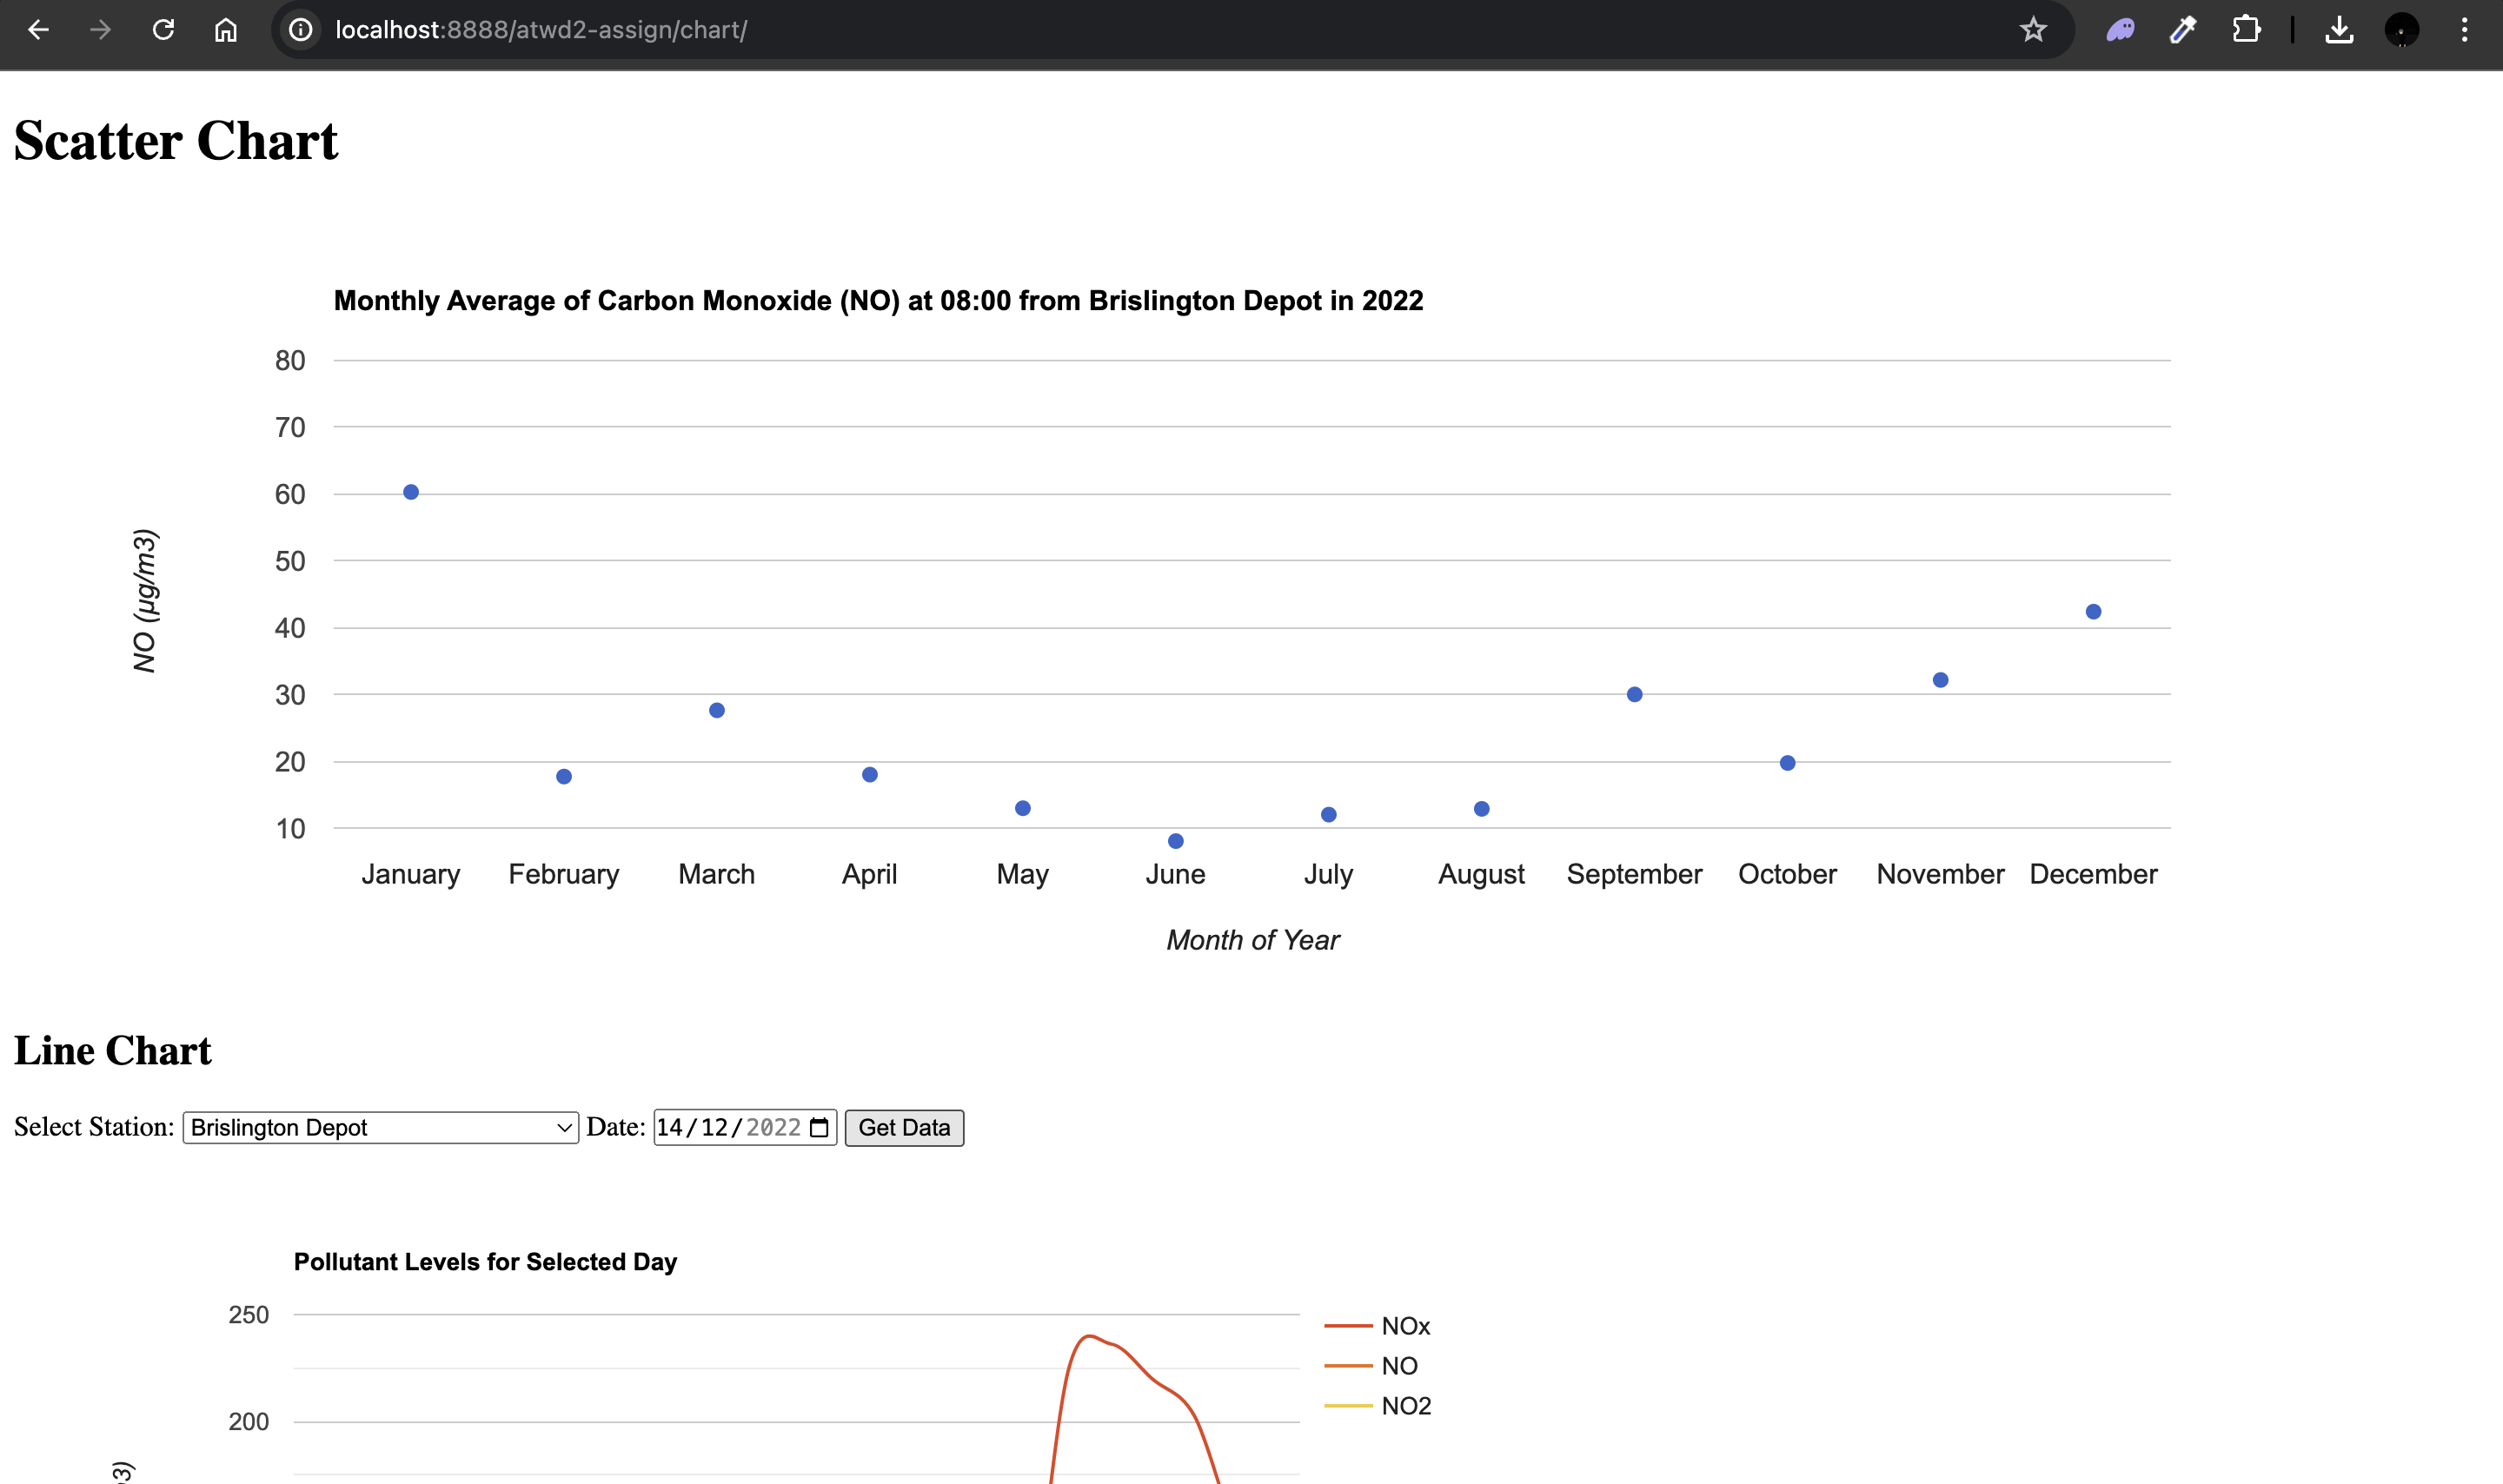
For data visualization, I used Google Charts to create interactive charts and Google Maps to plot pollution data geographically. This required integrating JavaScript and AJAX for dynamic and responsive user interactions.
The project provided valuable experience in handling large datasets, data normalization, and visualization using web technologies. Through this process, I enhanced my skills in PHP, XML, JavaScript, and data processing.
© copyright 2023 All right reserved | sh-portfolio Developed By Swam Htet Hein